All of history, side by side.
Pastlas puts 5,000 years of states, wars, people and works on one map and one timeline. Drag the year and watch the borders move, see what was happening everywhere at once, and follow what led to what, so history reads as patterns rather than isolated dates.
Free · No account · Built on open data: Wikidata, Wikipedia, Cliopatria, NOAA, V-Dem and more
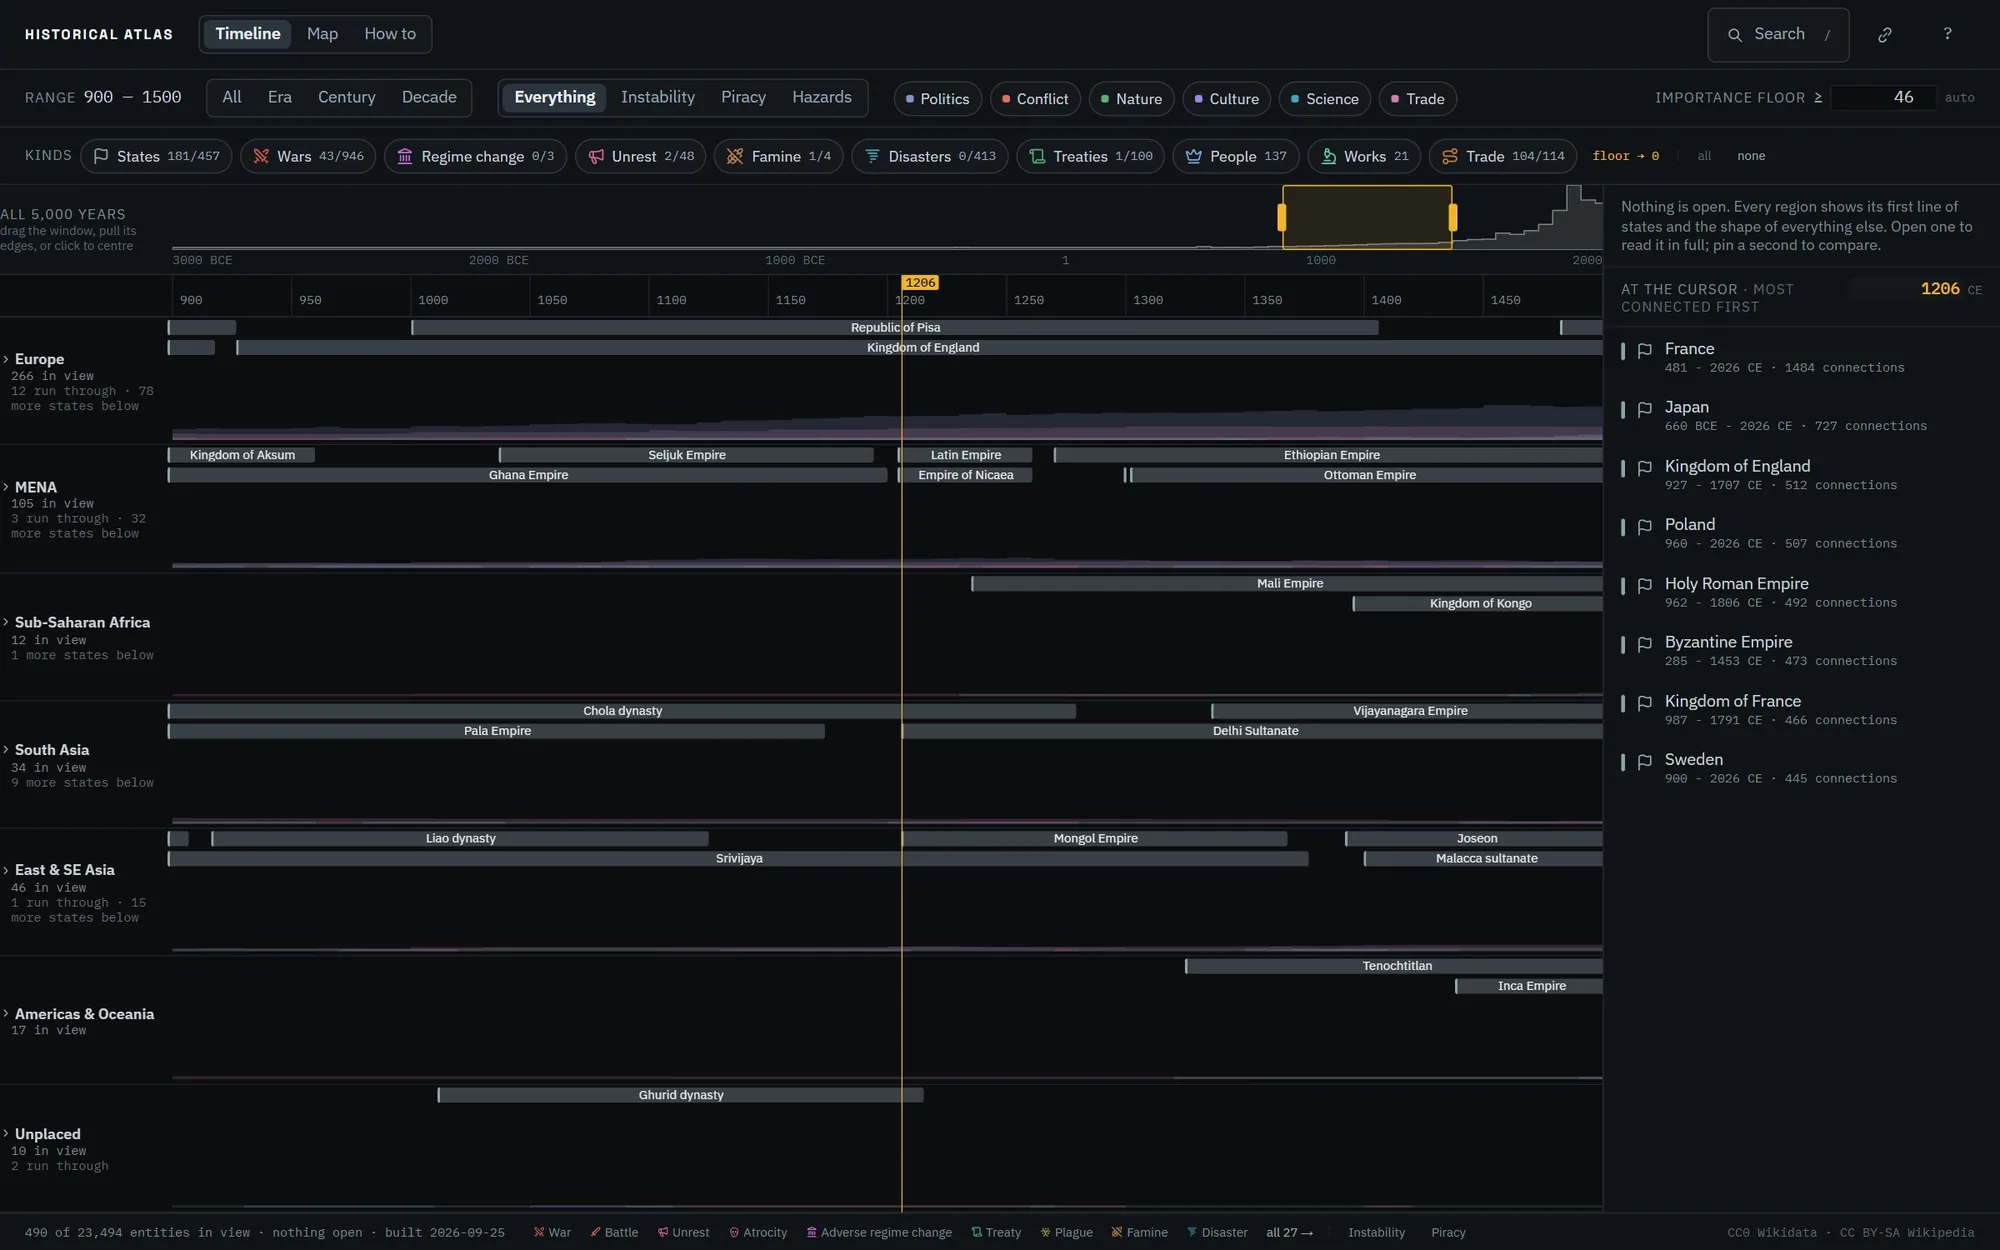 Six regions, one calendar
The year you are reading
The Mongol Empire, founded that year
Alive in 1206, most connected first
Six regions, one calendar
The year you are reading
The Mongol Empire, founded that year
Alive in 1206, most connected first
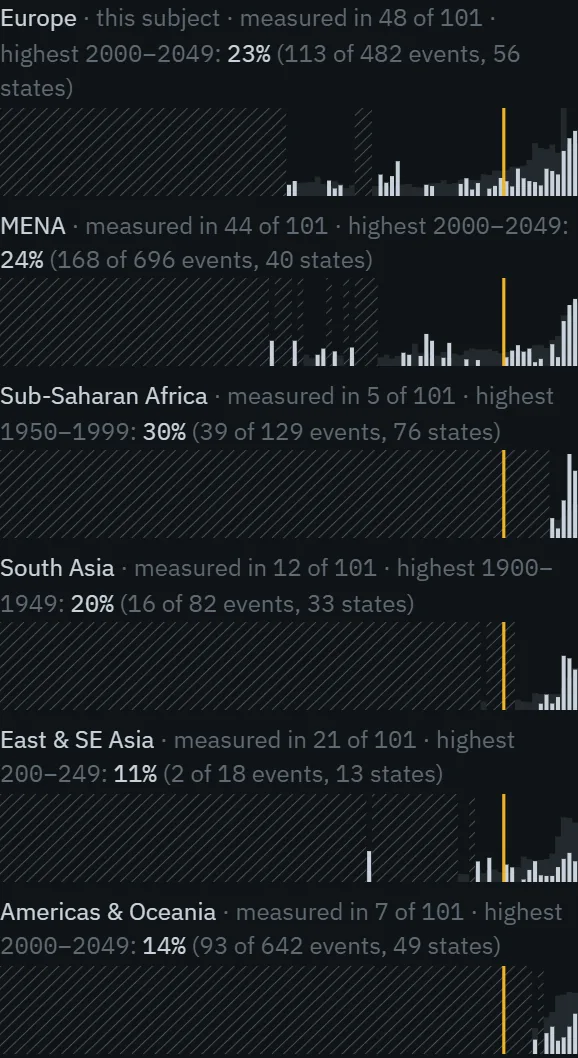
How often unrest followed within 40 years, across Europe, where the theory’s conditions were met and where they were not:
About 2.1× as often, with the strongest objection printed beside it.
- 5,000years, 3000 BCE to today
- 16,000+states, wars, people and works
- 13,765historical borders, drawn year by year
- 727states with flags, each shown in the years it flew
- 184trade routes, from the Silk Road to the Atlantic
- 11theories of history, tested against the record
A historical map for every year
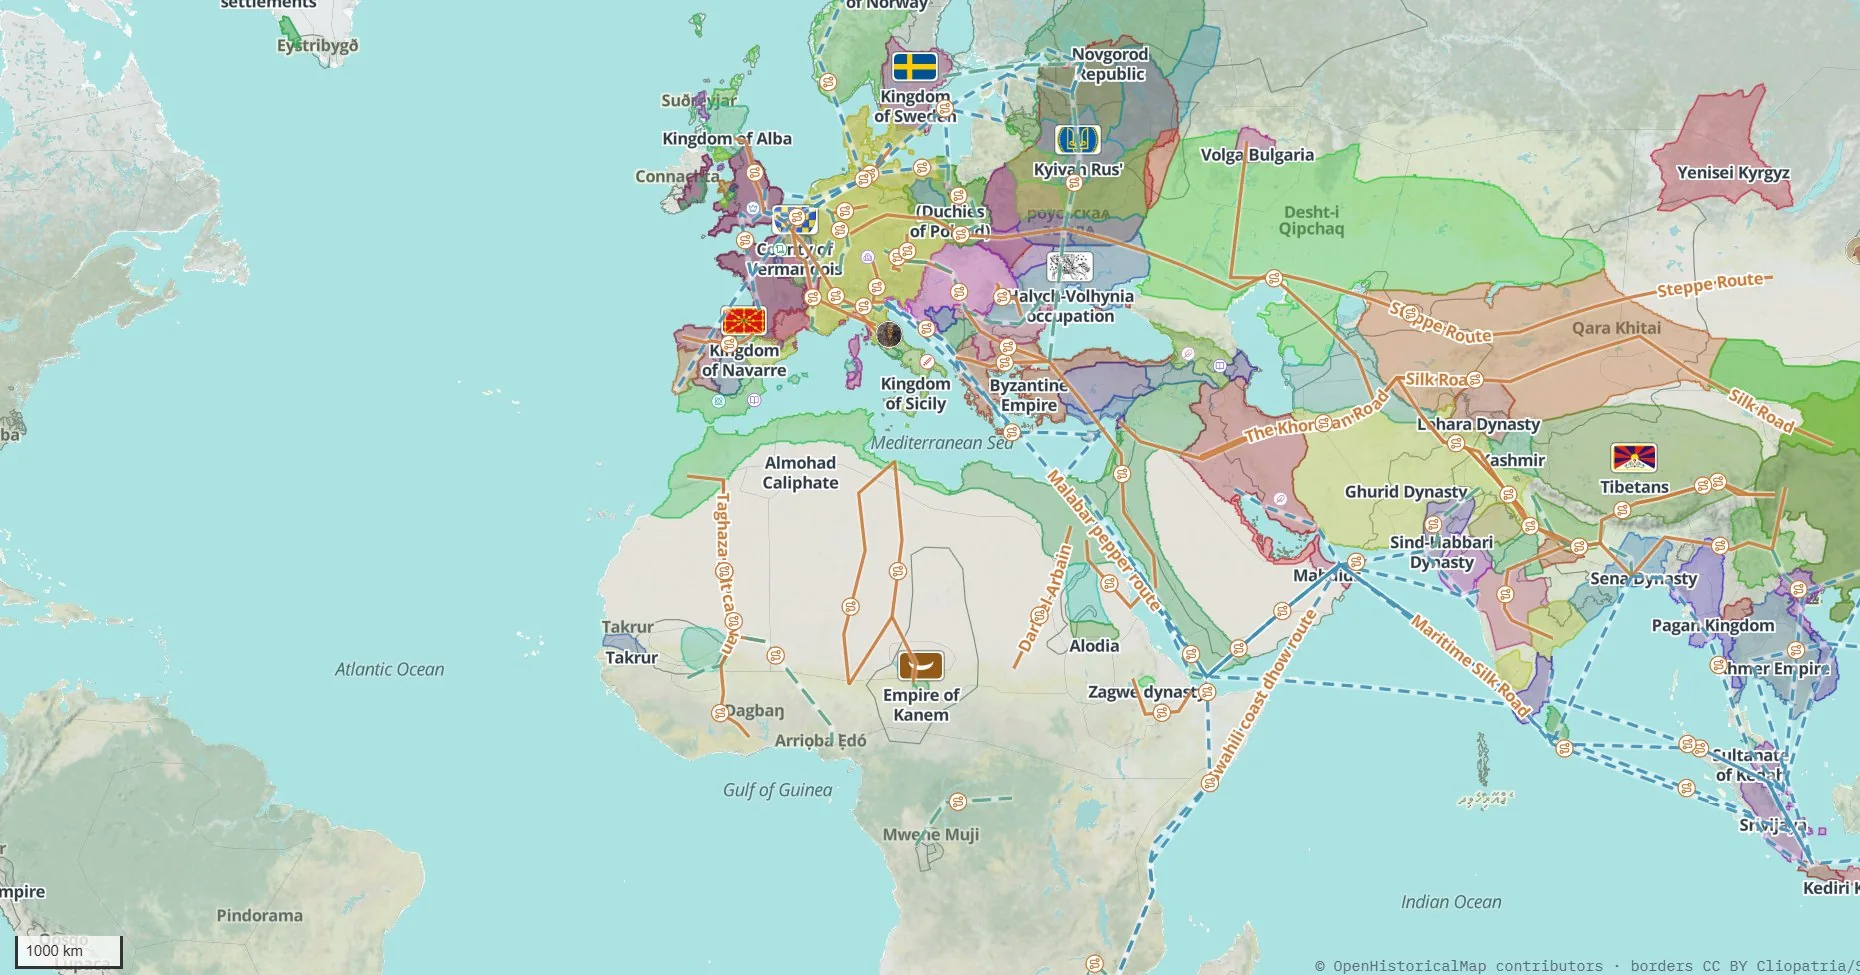
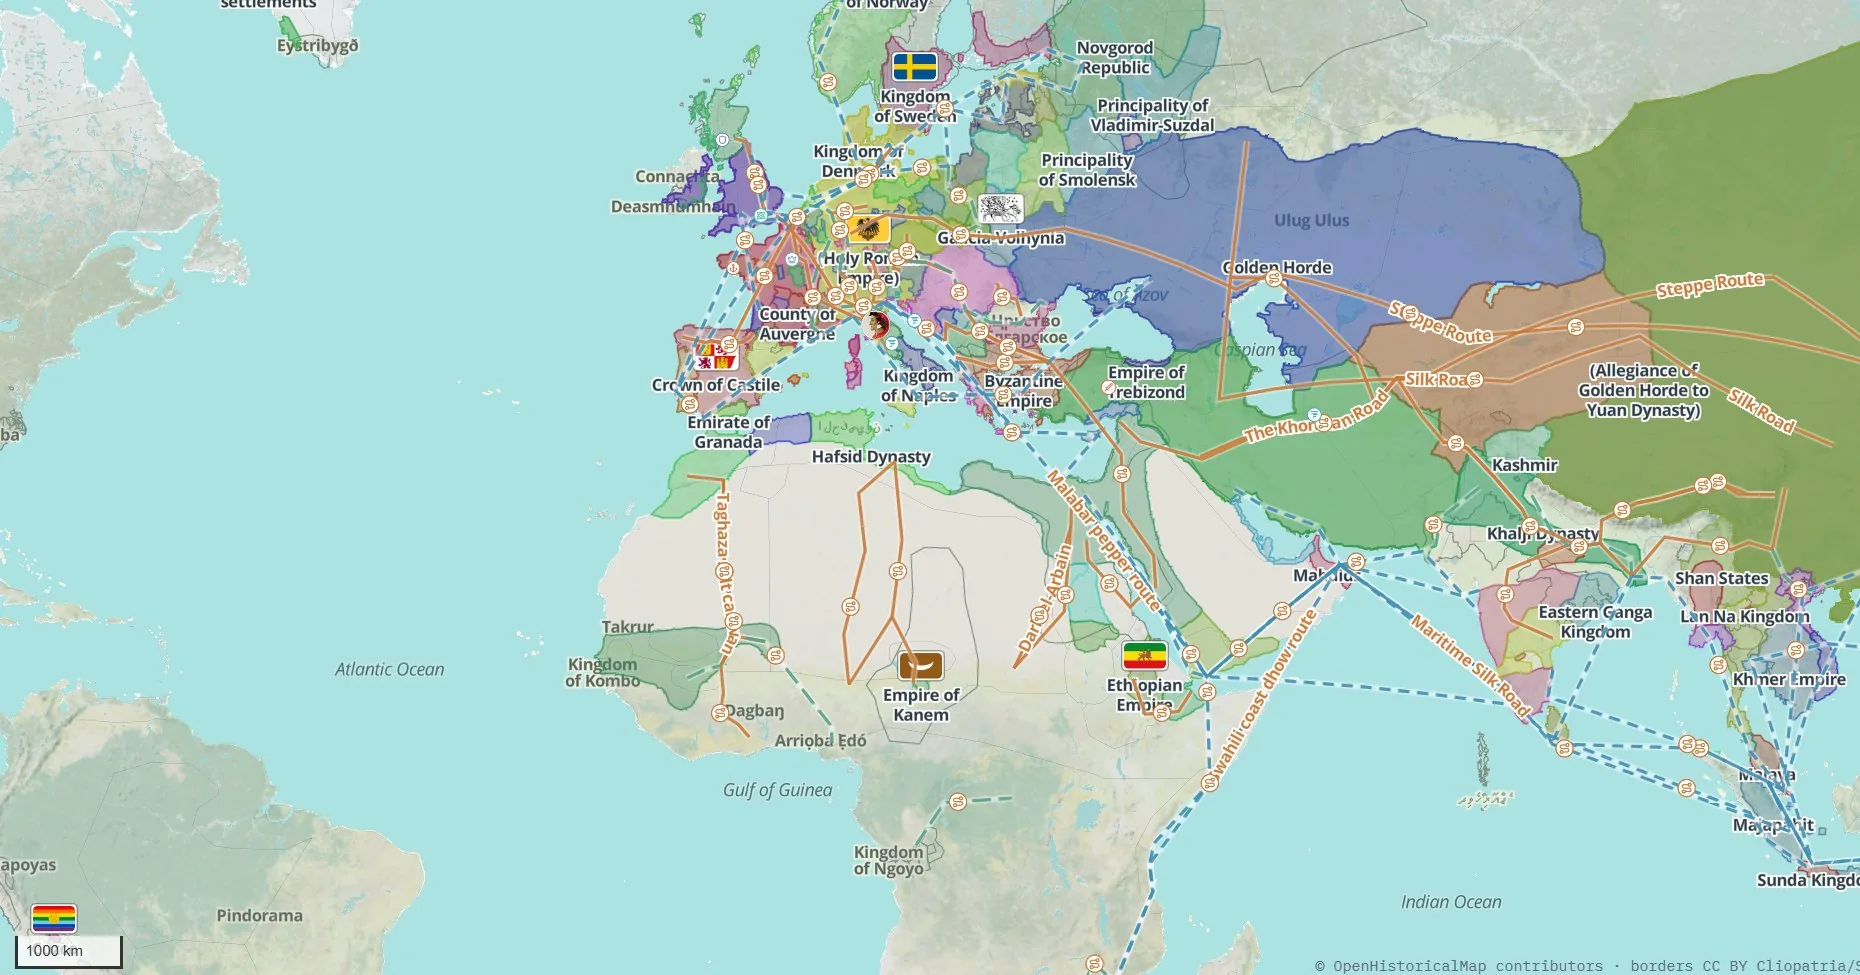
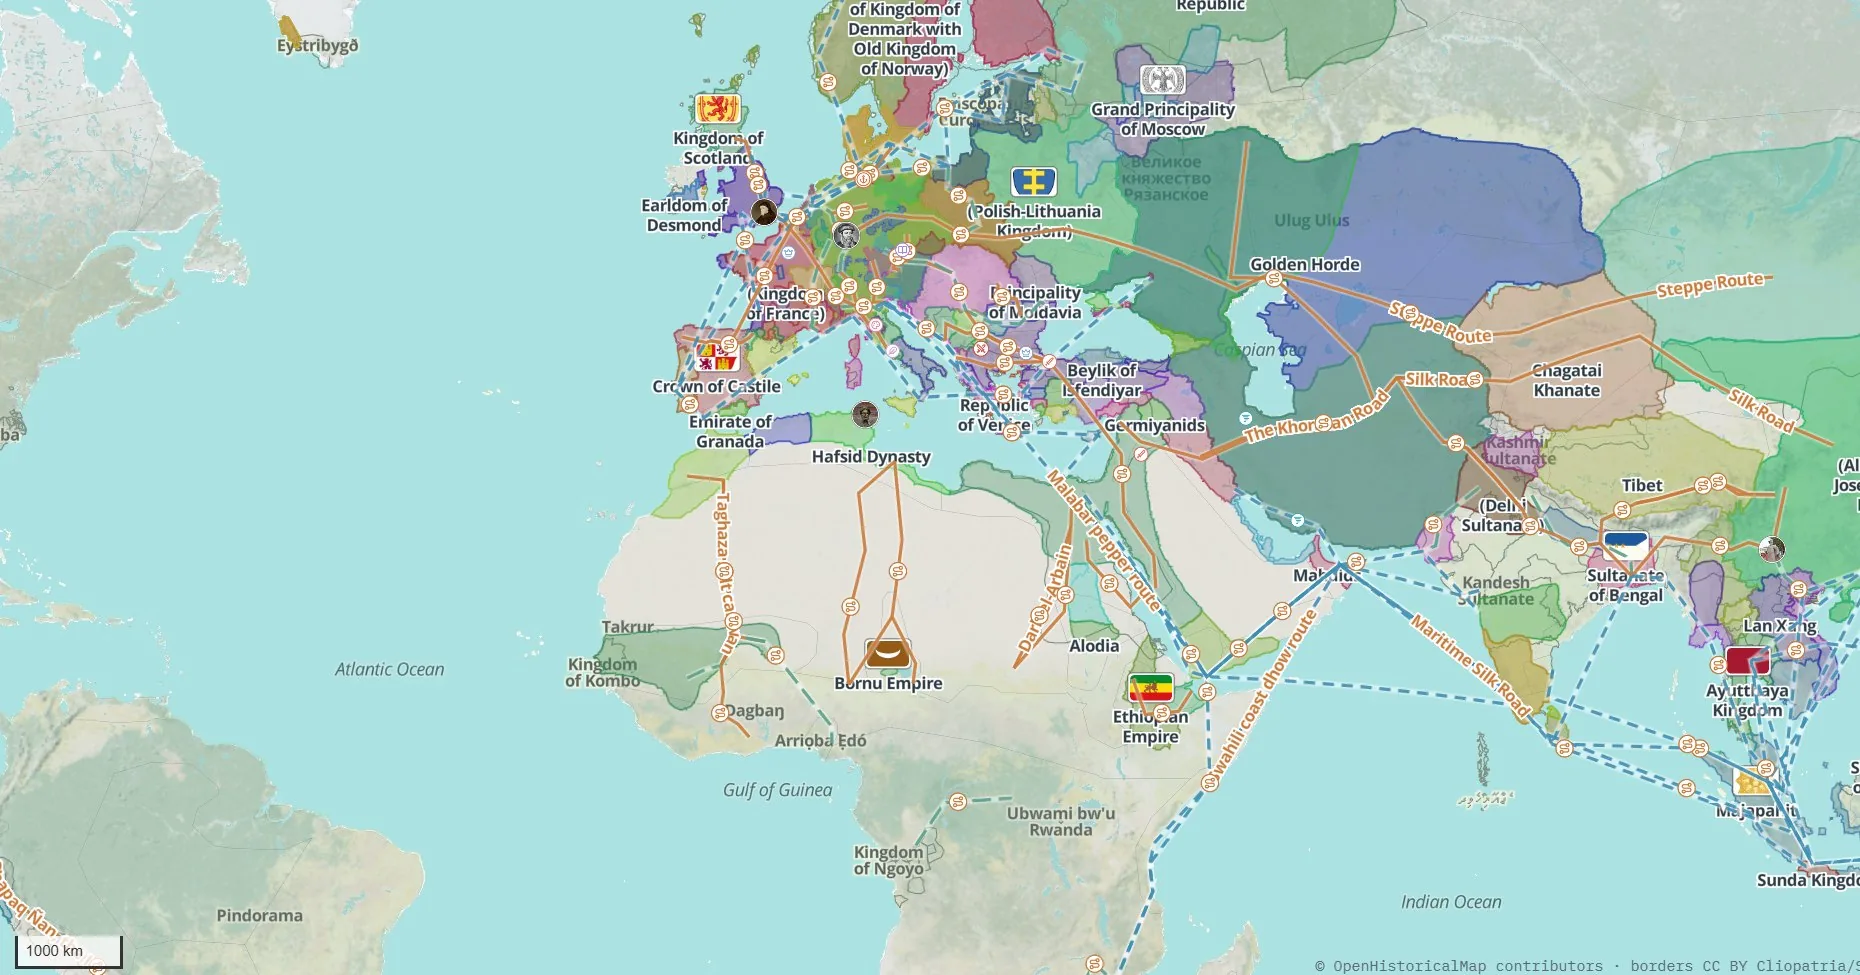
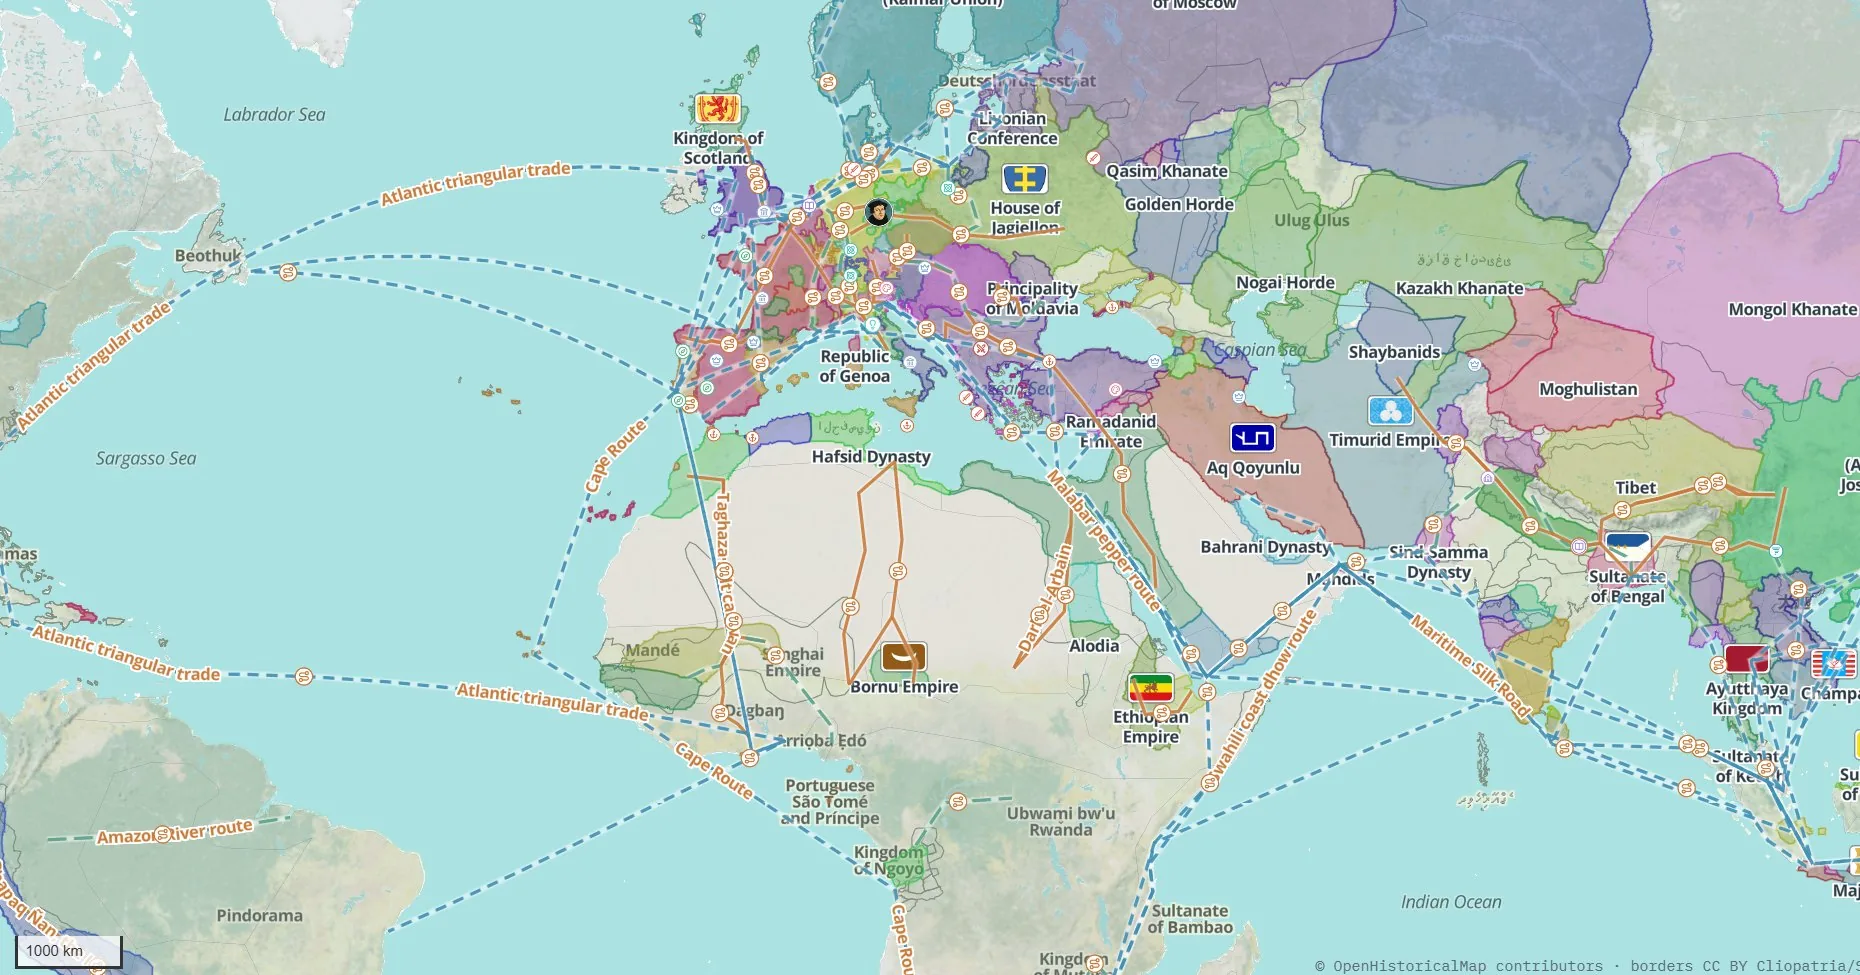
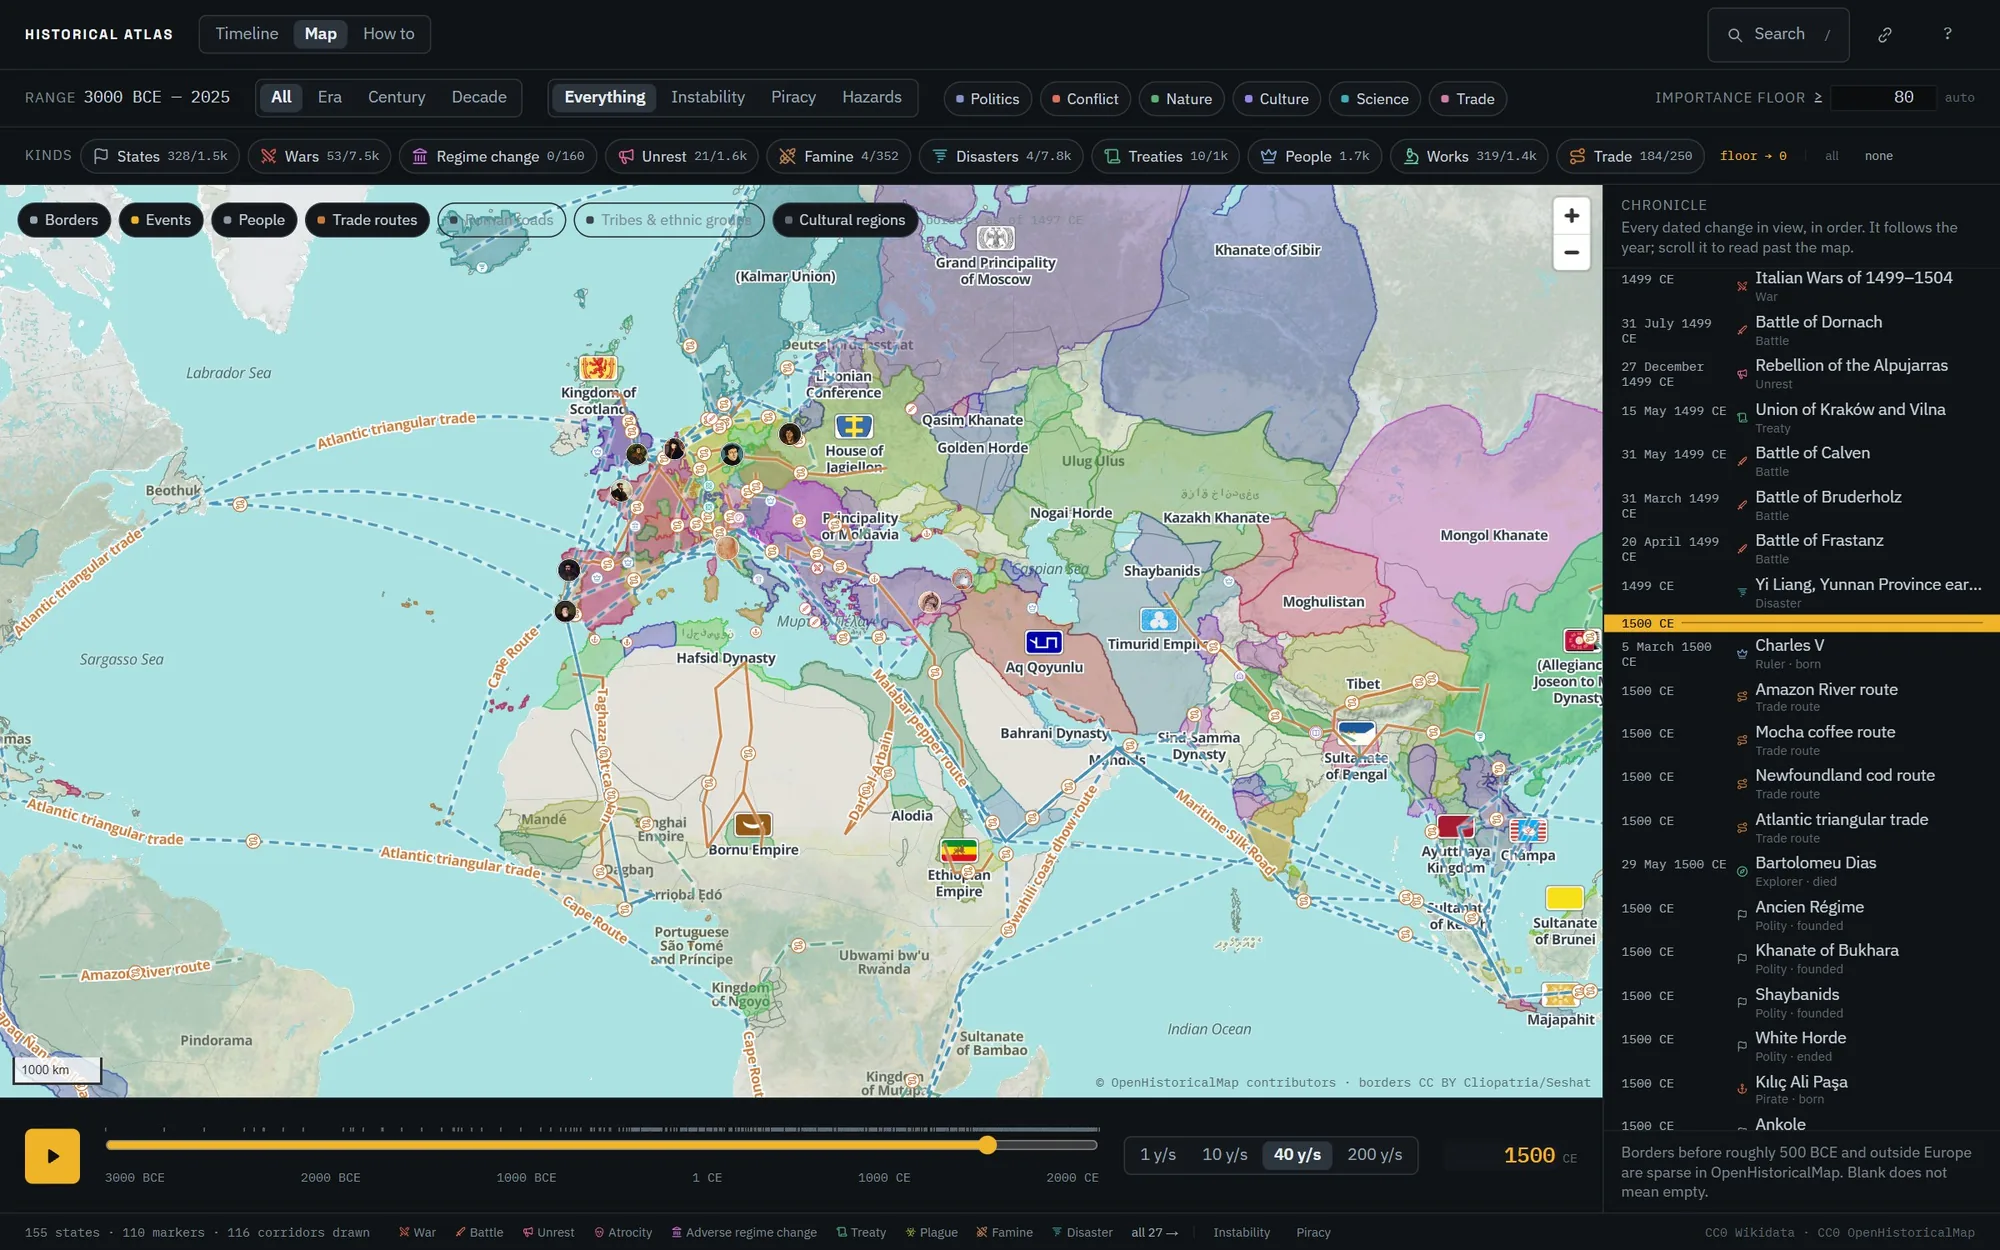
The map is the quickest way into Pastlas. Pick any year from 3000 BCE to today and the borders redraw for it, each state under the flag it flew, with the battles, people and trade routes of that moment on top. Press play and watch the centuries pass.
 1
2
3
4
5
6
1
2
3
4
5
6
- 1Layers: borders, events, people, trade routes, Roman roads, peoples and cultural regions
- 2Each state under the flag it flew that year
- 3184 trade routes, from the Silk Road to the Atlantic triangular trade
- 4People and events, placed where they happened
- 5The chronicle: every dated change in view, in order
- 6Drag the year, or press play at 1 to 200 years a second
One century, the same frame
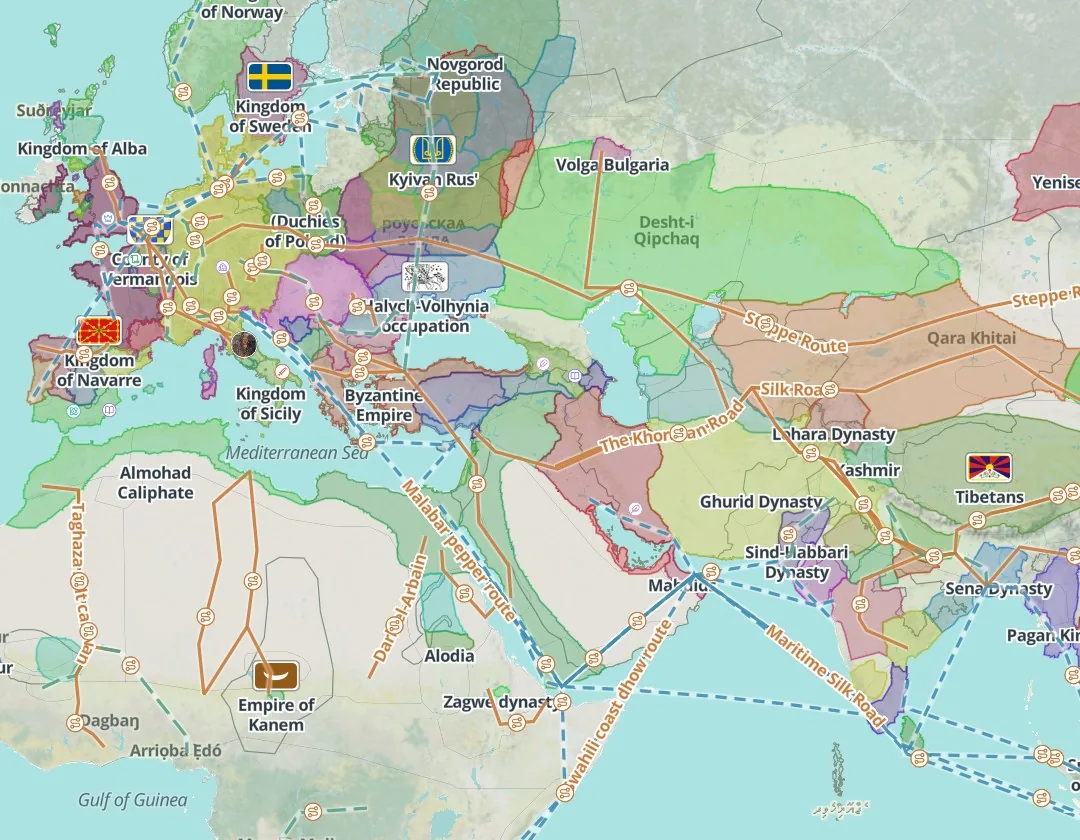
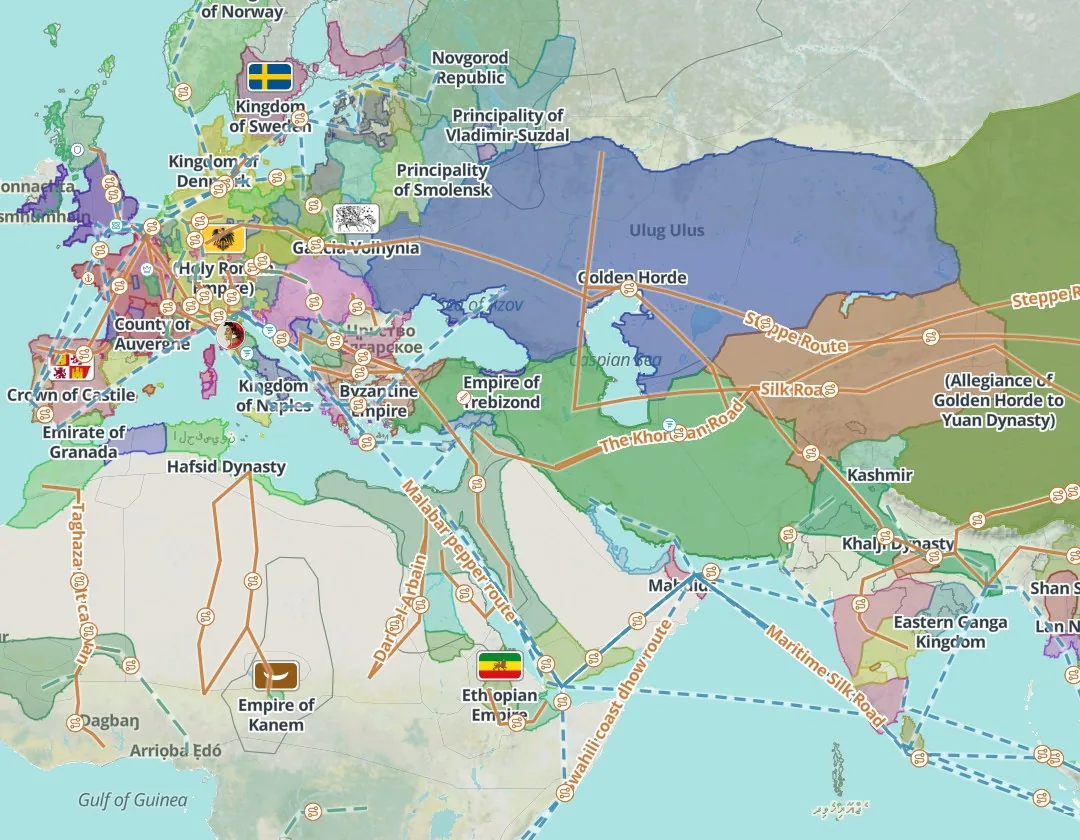
Between 1200 and 1300 the Mongol conquests redraw the map of Eurasia. On Pastlas you watch it happen by dragging a single slider.
 1200
1200
 1300
1300
Redrawn for the year on screen, from the Cliopatria dataset’s 13,765 shapes.
The Kingdom of Hungary alone has nineteen, each drawn only in its own years.
184 trade corridors, and the Roman road network as its own layer.
Watch centuries pass at 1, 10, 40 or 200 years a second.
Events don’t happen alone
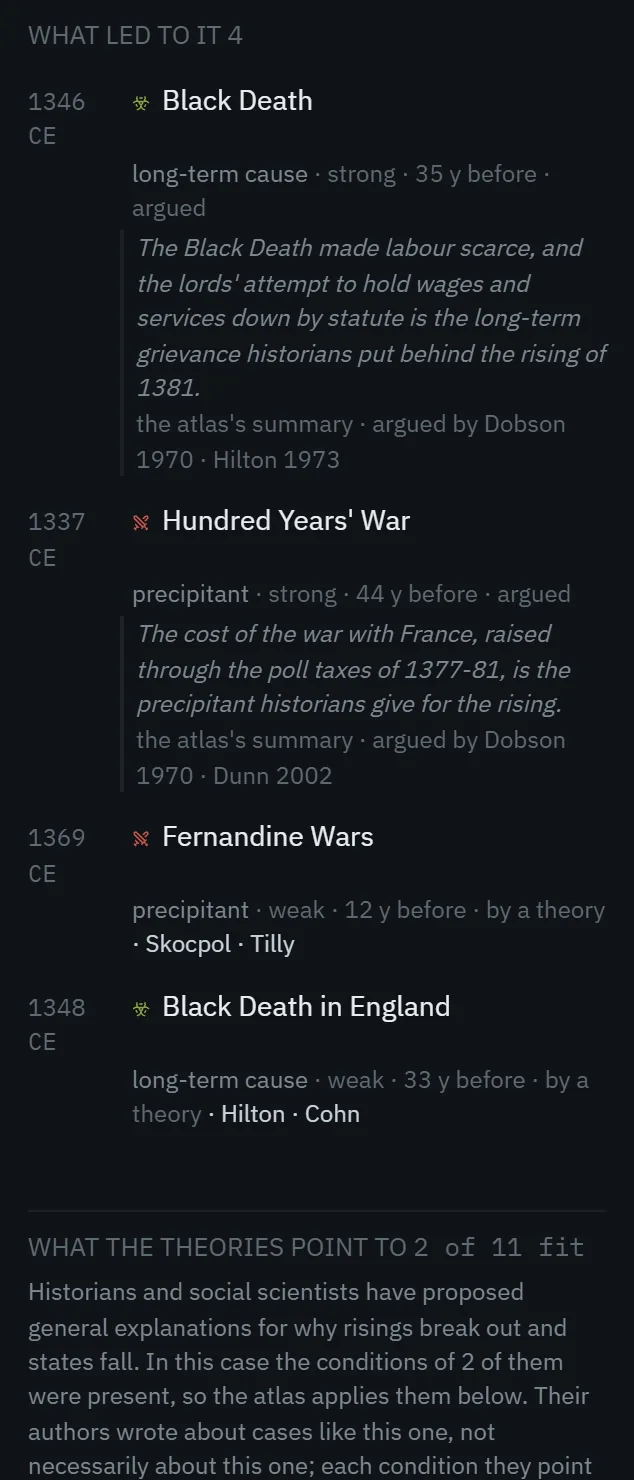
Every event sits inside others: the war that paid for it, the plague a generation before, the state it happened in. Most history hands you one of them at a time. Pastlas keeps the rest on screen, on the map and on the timeline, so you read causes and consequences instead of isolated dates.
- The Black Death, 35 years beforeA long-term cause, argued by Dobson and Hilton
- The Hundred Years’ WarIts cost, raised through the poll taxes of 1377–81: the precipitant Dobson and Dunn name
- Theories that fit the caseHilton and Cohn on plague and revolt, Skocpol and Tilly on war
- Every link names its sourceA record, an article, a historian or a theory, and the atlas always says which
A world history timeline, every region side by side
Six regions on one calendar, so the Song dynasty, the Kamakura shogunate and Genghis Khan sit where they belong: next to each other, and next to Europe, Africa and the Americas.
Drag through time and zoom from five thousand years to a single decade. Filter by kind — states, wars, revolts, treaties, disasters, people, works — in one click.
1
2
3
4
5
- 1Six world regions on one calendar
- 2The year you are reading: 1206
- 3The Mongol Empire, founded that year, beside the Delhi Sultanate, the Latin Empire and Srivijaya
- 4What existed at the cursor, most connected first
- 5All 5,000 years at a glance
Open a region to read it in full
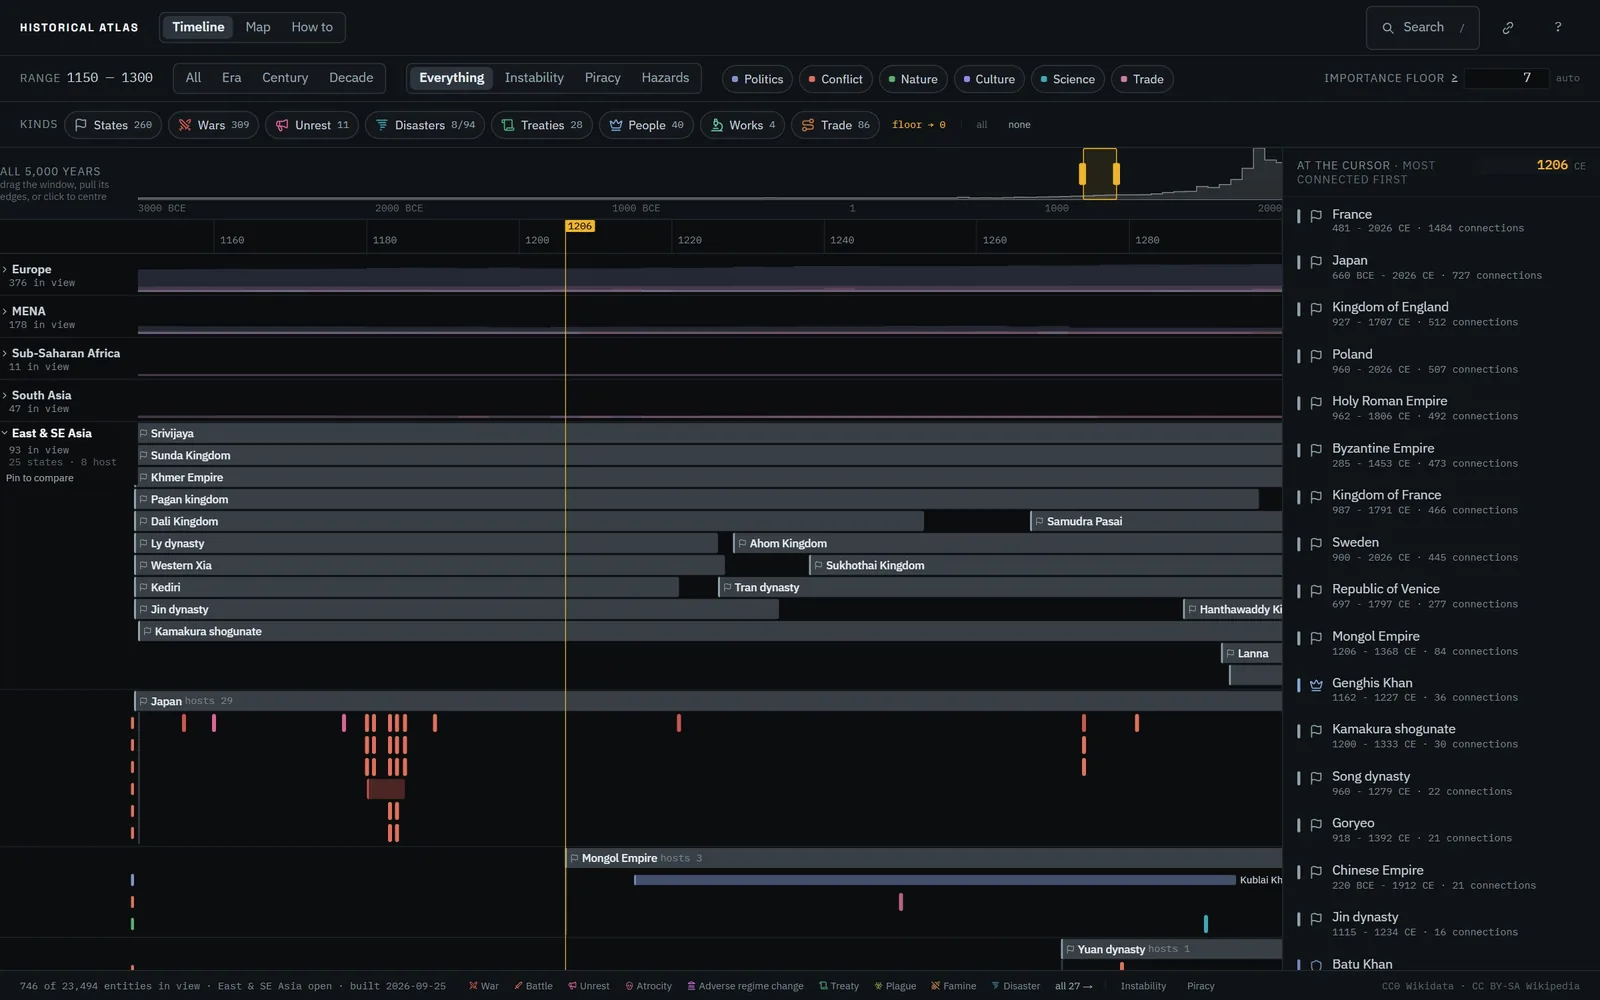
Each state is drawn with the people, battles and works it hosted. The Genpei War’s battles sit under Japan, Kublai Khan under the Mongol Empire.
- 1The Genpei War’s battles, 1180–85, hosted by Japan
- 2Kublai Khan, under the Mongol Empire that hosted him
1
2
From single events to patterns
Put thousands of events in context and patterns appear. Pastlas measures what share of the record was instability — risings, regime changes, massacres — in every region and half-century, across five thousand years.
Where the record is too thin to say, the chart is hatched and tells you why. A quiet record is not a calm century.
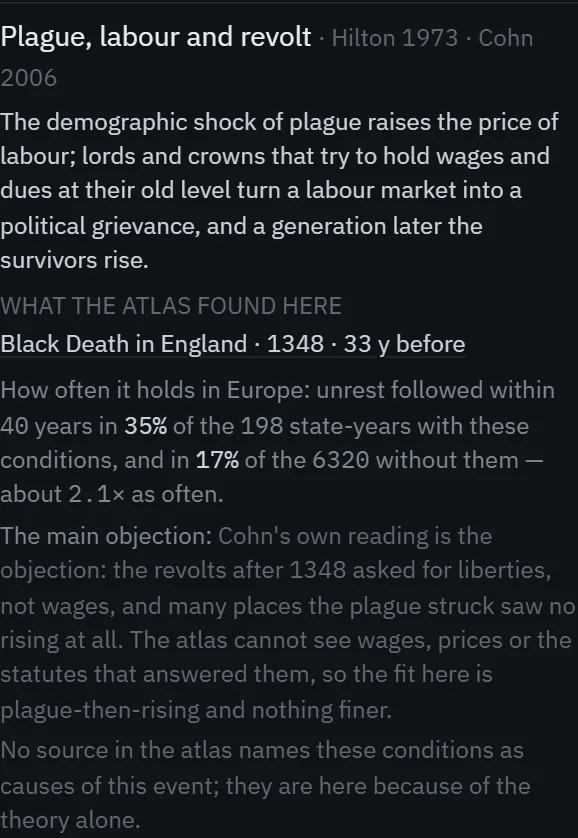
Across Europe, unrest followed within 40 years in 35% of the 198 state-years that met Hilton and Cohn’s conditions for plague and revolt, and in 17% of the 6,320 that did not: about 2.1× as often.
The strongest objection is printed beside the number, and so is what the atlas cannot see: wages, prices and the statutes that answered them.
Goldstone, Turchin, Ibn Khaldun, Huntington, Skocpol, Tilly, Toynbee and others, each tested against every state and year, with and without its conditions.
Compare up to six events side by side on the same questions, and see where they rhyme.
Volcanic winters and droughts, from records that don’t depend on anyone writing things down, set against the changes of ruler.
When a pattern isn’t there, the atlas says so. A comparison that could not say no would not be a comparison.
What happened in any year, and where
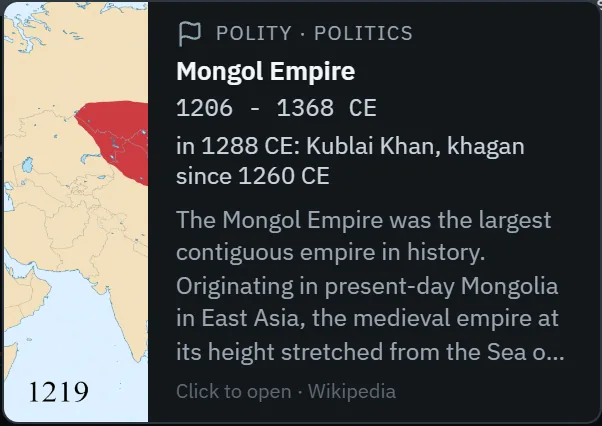
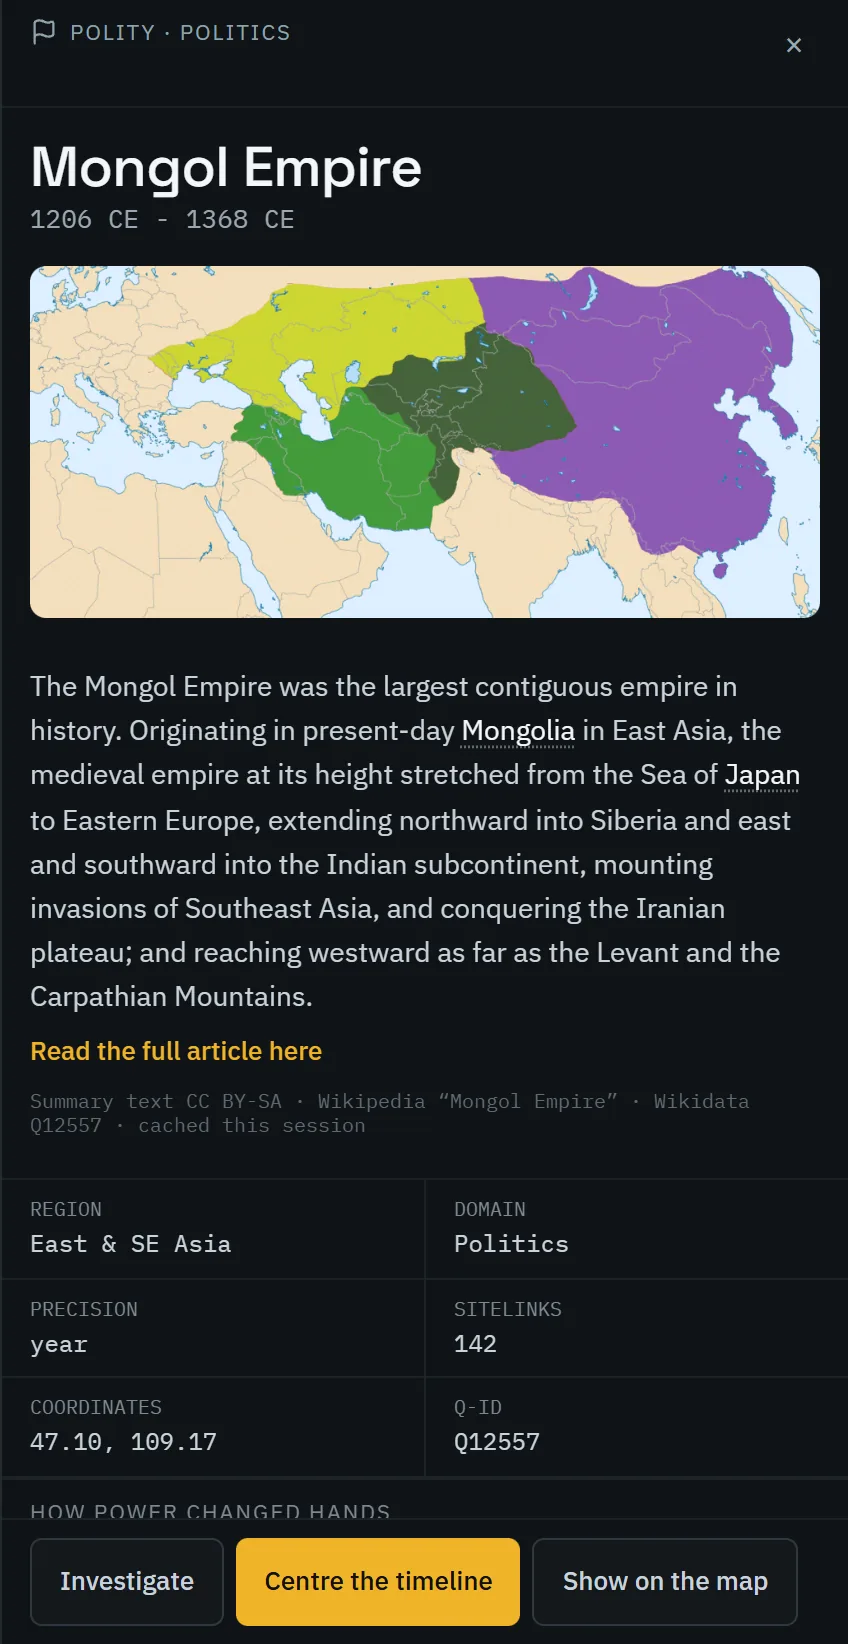
Hover over anything, on the map or the timeline, for a preview. Click to read its article inside the atlas, beside what the record says about it.
- Who ruled in the year on screen: the Mongol Empire in 1288 reads Kublai Khan, khagan since 1260.
- Where it happened: on the map, inside the state that held that ground in that year.
- Its connections: what led to it, what happened during it and what came of it, each naming the statement behind it.
- For a state: how power changed hands, what it rested on, and how much ground it held, year by year.

Ask why it happened
Investigate turns the timeline into an answer. Everything unrelated falls away, and what remains is joined to your question by the evidence behind each link.
Recorded, argued, read from the article, or implied by a theory.
Doyle and Schama on 1789, Figes and Fitzpatrick on 1917, for and against.
Shown first when their conditions were present, with the main objection.
The whole investigation as plain text, with sources and a link back.
Honest about what it doesn’t know
History is full of gaps and disagreements. Seeing the whole picture means seeing those too, so Pastlas shows them instead of smoothing them over.
Every link names its source
A recorded statement, an article’s sentence, a historian or a theory. Never a guess from being nearby.
A blank always says why
Nothing on record, filtered out, or outside your years: three different facts that never look alike.
Two sources, two dates
NOAA dates the Thera eruption to 1610 BCE, Wikidata to 1601. You see both, never an average.
A quiet record is not a calm century
Where the record is thin, the atlas marks it unmeasured rather than drawing peace.
For anyone who has ever asked what else was happening at the time
Historians and researchers
Test a claim against the record, compare cases side by side, and follow every link back to its source.
Teachers and students
Show the world at one moment on the map, and share the exact view with a single link.
Curious readers
Press play on the map, stop anywhere, hover over anything, and let the one-minute tour show you around.
Built on open data, credited everywhere
Every entry says where its data came from, and nothing from different sources is averaged into a figure neither of them gives.
The licence for every source is listed inside the atlas, on the How to page.
Help us get it right
OPENING SOONBuilt from open data, the atlas is sometimes wrong, and the people best placed to fix it are the people who know the history. A short form, linked from every entry with the entry already filled in, will let you tell us what’s wrong and what your source says.
See what’s new
Every change and every correction, newest first, in plain words.
What is Pastlas?
An interactive history map and world history timeline. It shows all of history side by side: more than 16,000 states, wars, people and works from 3000 BCE to today, so events can be read in context.
Can I see a historical map of a specific year?
Yes. Open the map, type a year or drag the slider, and the borders, flags, trade routes and events redraw for that year, anywhere from 3000 BCE to today.
How do I see what happened in a given year?
Move the year cursor. The timeline lists what existed and happened then in every region, and the chronicle beside the map lists every dated change in view.
Does it show causes, or only dates?
Both. Each entry lists what led to it and what came of it, and says whether each link is recorded, argued by historians, read from an article or implied by a theory.
Is it free?
Yes. There is nothing to install and no account to create.
Where does the data come from?
From Wikidata, Wikipedia and open research datasets such as Cliopatria, NOAA, V-Dem and the Maddison Project. Every entry names its sources.
How accurate is it?
As accurate as the record it is built from, and that record follows scholarship: Europe and East Asia are well covered, Sub-Saharan Africa and the pre-Columbian Americas less so. Where the atlas is thin it says so.
Can I share or cite what I find?
Every view has its own link that opens exactly what you see, and an investigation can be copied or downloaded as plain text with its sources.
Does it work on my phone?
Pastlas is made for a desktop screen. On a phone you get the map and search.
Who makes Pastlas?
Pastlas is made by Oleh Voronko, and built on open data.
All of history, side by side.
Start on the map in 1206, the year the Mongol Empire was founded, or anywhere at all.